One of the things that sets great marketers apart is their ability to spot opportunities others might miss. In the B2B food industry, this could mean uncovering opportunities for a new product line, a product iteration, or even exploring a different customer segment. But how do they do it? Most times, there are key practices that great marketers follow to uncover new insights. In this post, we will explore three tips to help you turn data into insights and uncover potential opportunities for your B2B food business.

Connecting the Dots
In this technology-driven era, all marketers are aware that collecting and reviewing relevant data is key to the success of their products or services. When it comes to market research, there are many sources of information, with customer visits often serving as a primary resource for B2B food businesses. However, it is even more critical to be able to take those inputs and connect the dots to tell a story with the data and uncover opportunities.
This is no easy task, but the ability to spot insights within the results of your market research efforts is a skill highly crucial for great marketers. So, where can you start?
Tip #1: Organize Data Effectively
The road to meaningful insights starts with well-organized data. This means that, before diving into analysis, you need to ensure your data is complete, clean, categorized, and structured in a way that makes patterns easier to identify.
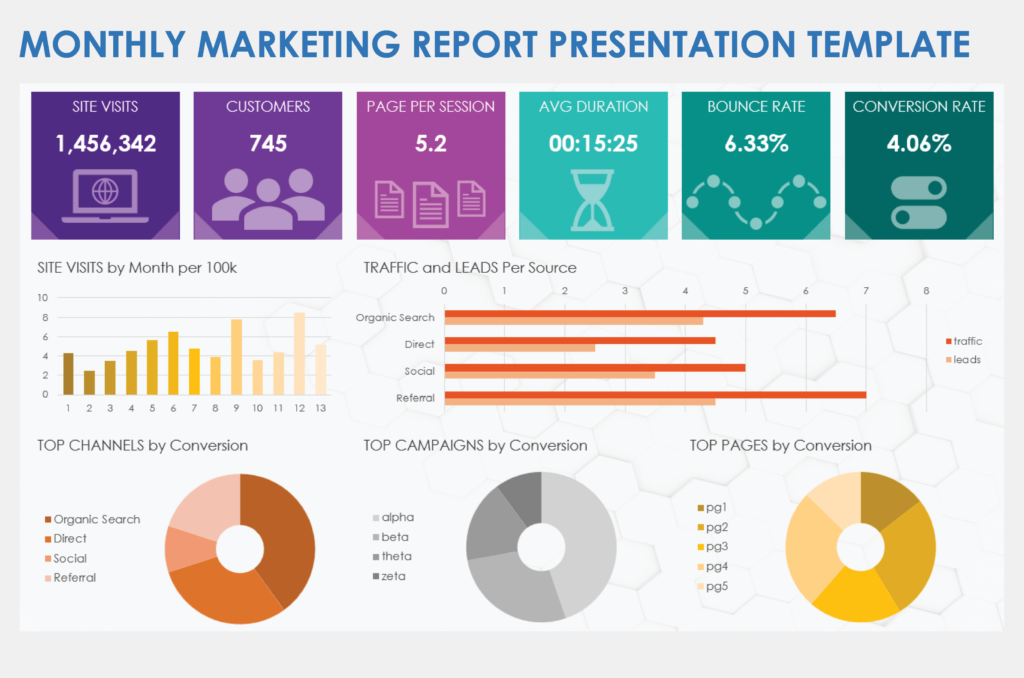
To achieve this, most corporations nowadays use business intelligence tools like Power BI or visualization tools like Tableau. These tools allow data to be organized into dashboards and easily segmented by demographics, regions, or timeframes to create clarity and prepare for deeper analysis.
If this feels too advanced and your data is still managed on a basic spreadsheet, start by using features like pivot tables or exploring my free Excel template as a resource to inspire your data visualization. Taking the time to organize your data properly can make all the difference.
Tip #2: Spot Patterns
Once your data is organized and you can easily filter the information, it’s time to start exploring it. Filter different customer segments, analyze seasonality, or examine product sizes—your options are endless.
Often, analysis begins with a broad approach, focusing on overall results. However, when you start grouping data into specific segments, interesting trends can emerge. In the B2B sector, your ideal customer profiles (ICPs) can offer clues about which factors to use for segmentation.
For example, if your company primarily sells to businesses with an average of 50 employees, you might want to explore how companies of varying sizes behave differently when it comes to sales of a specific product. Initially, this process of “playing around” with data may feel unfamiliar, but with practice, it becomes a skill that guides teams in effective directions.
Tip #3: Infer Causes or Explanations
Let’s say your data is organized and easy to skim and filter, and you have identified a trend showing that your key accounts tend to stock up on Product A during the summertime. Now, what could this be about?
This is where your industry expertise, company knowledge, and further research come into play. Use this opportunity to brainstorm potential causes or explanations for the trend. Most of the time, your sales teams can answer these questions, but it’s always helpful to approach them with hypotheses in hand. This can clarify what might influence certain behaviors and give you a better understanding of how to act on these insights.
With this information, you can develop actionable steps to leverage these findings and create strategies that drive results. With these easy steps, you can transform rich data into actionable insights that could boost sales and enhance financial performance.
Final Thoughts
By organizing data effectively, spotting patterns, and uncovering the causes behind trends, you can identify new opportunities and develop strategies that drive meaningful results. But remember, the real power of data lies in how you interpret and apply it. With everything that explored in this post, are you ready to start transforming your data into opportunities? The results might surprise you.